Run Records
A summary of every replay run: status, token usage and duration at a glance, with per-step diagnostics one click away.
Run records list → View detail (jumps to the case detail's Run Records tab)
Run list
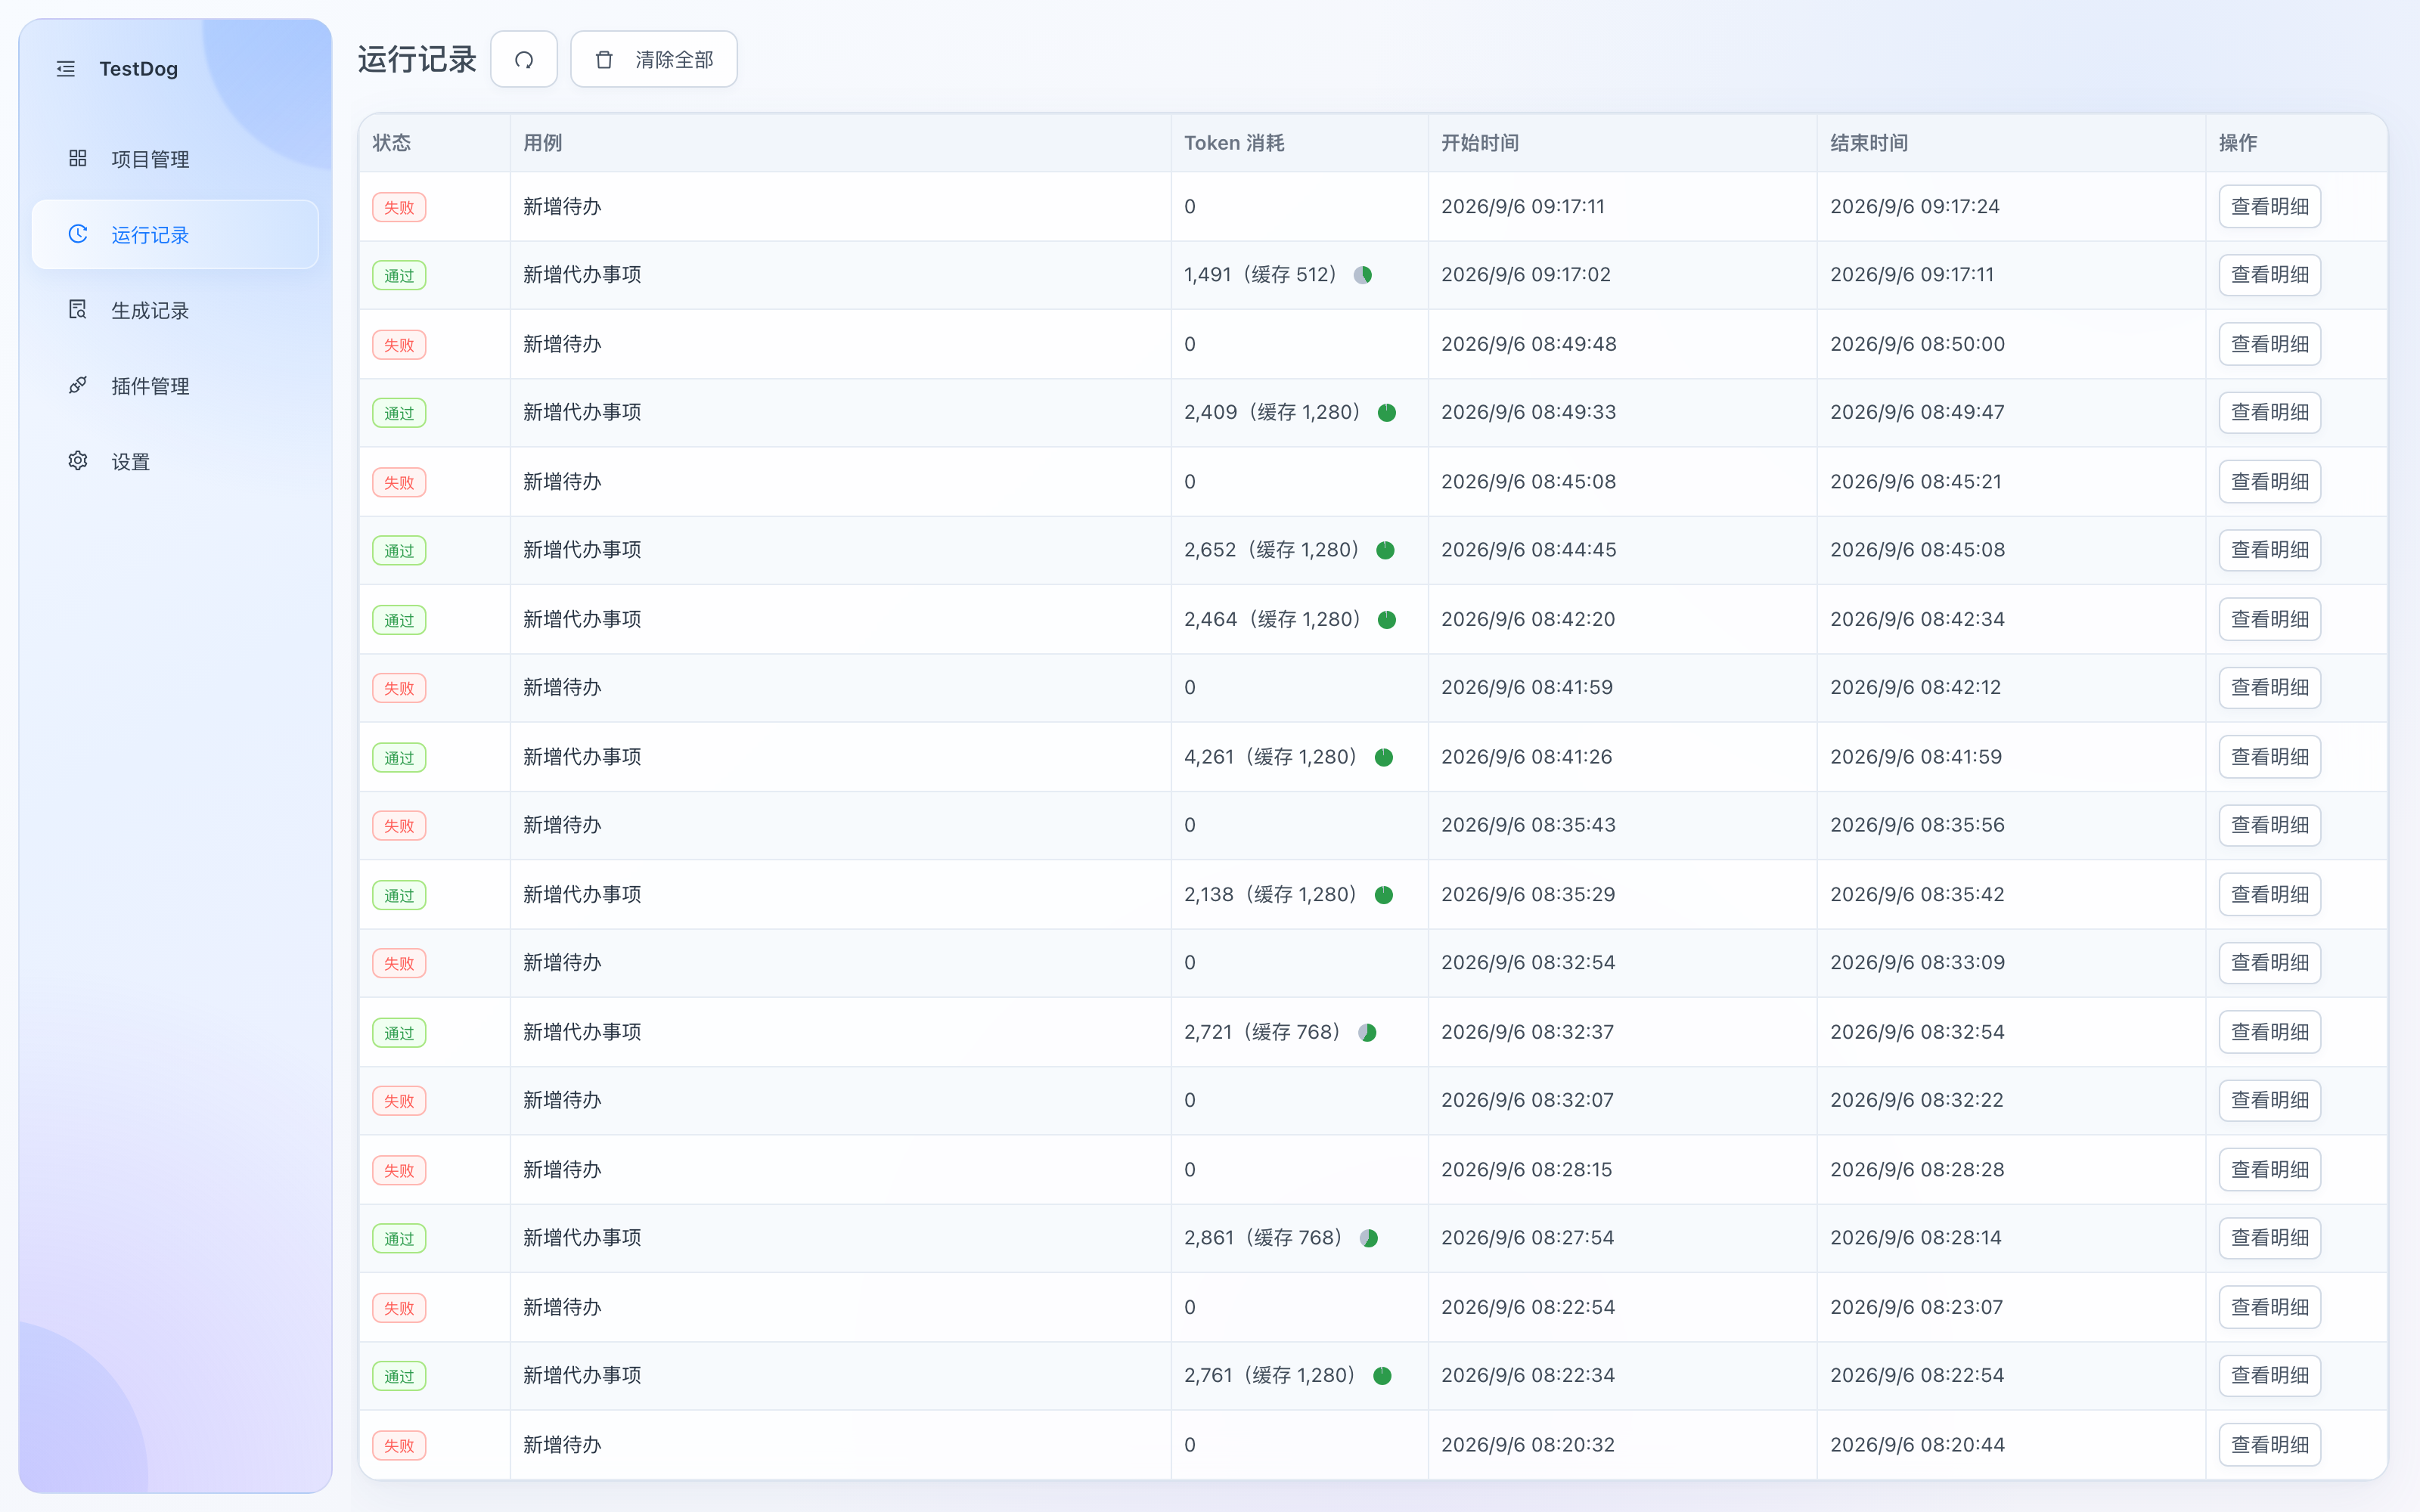
Run records: status, case, token usage (cache hits shown), start/end time
| Column | Description |
|---|---|
| Status | Passed / Failed |
| Case | The case this run belongs to |
| Token usage | Tokens consumed by AI self-healing during the run (replay itself costs zero LLM tokens; the green dot shows the cache-hit share, which costs far less than normal calls) |
| Start / End time | Time range of the run |
| Action | View detail |
Toolbar: Refresh, Clear All (clean up history runs).
Row action: View detail jumps to the case detail's Run Records tab and locates that run; clicking anywhere on the row also opens the case detail.
View detail
Clicking View detail opens the case detail's Run Records tab, where you can inspect:
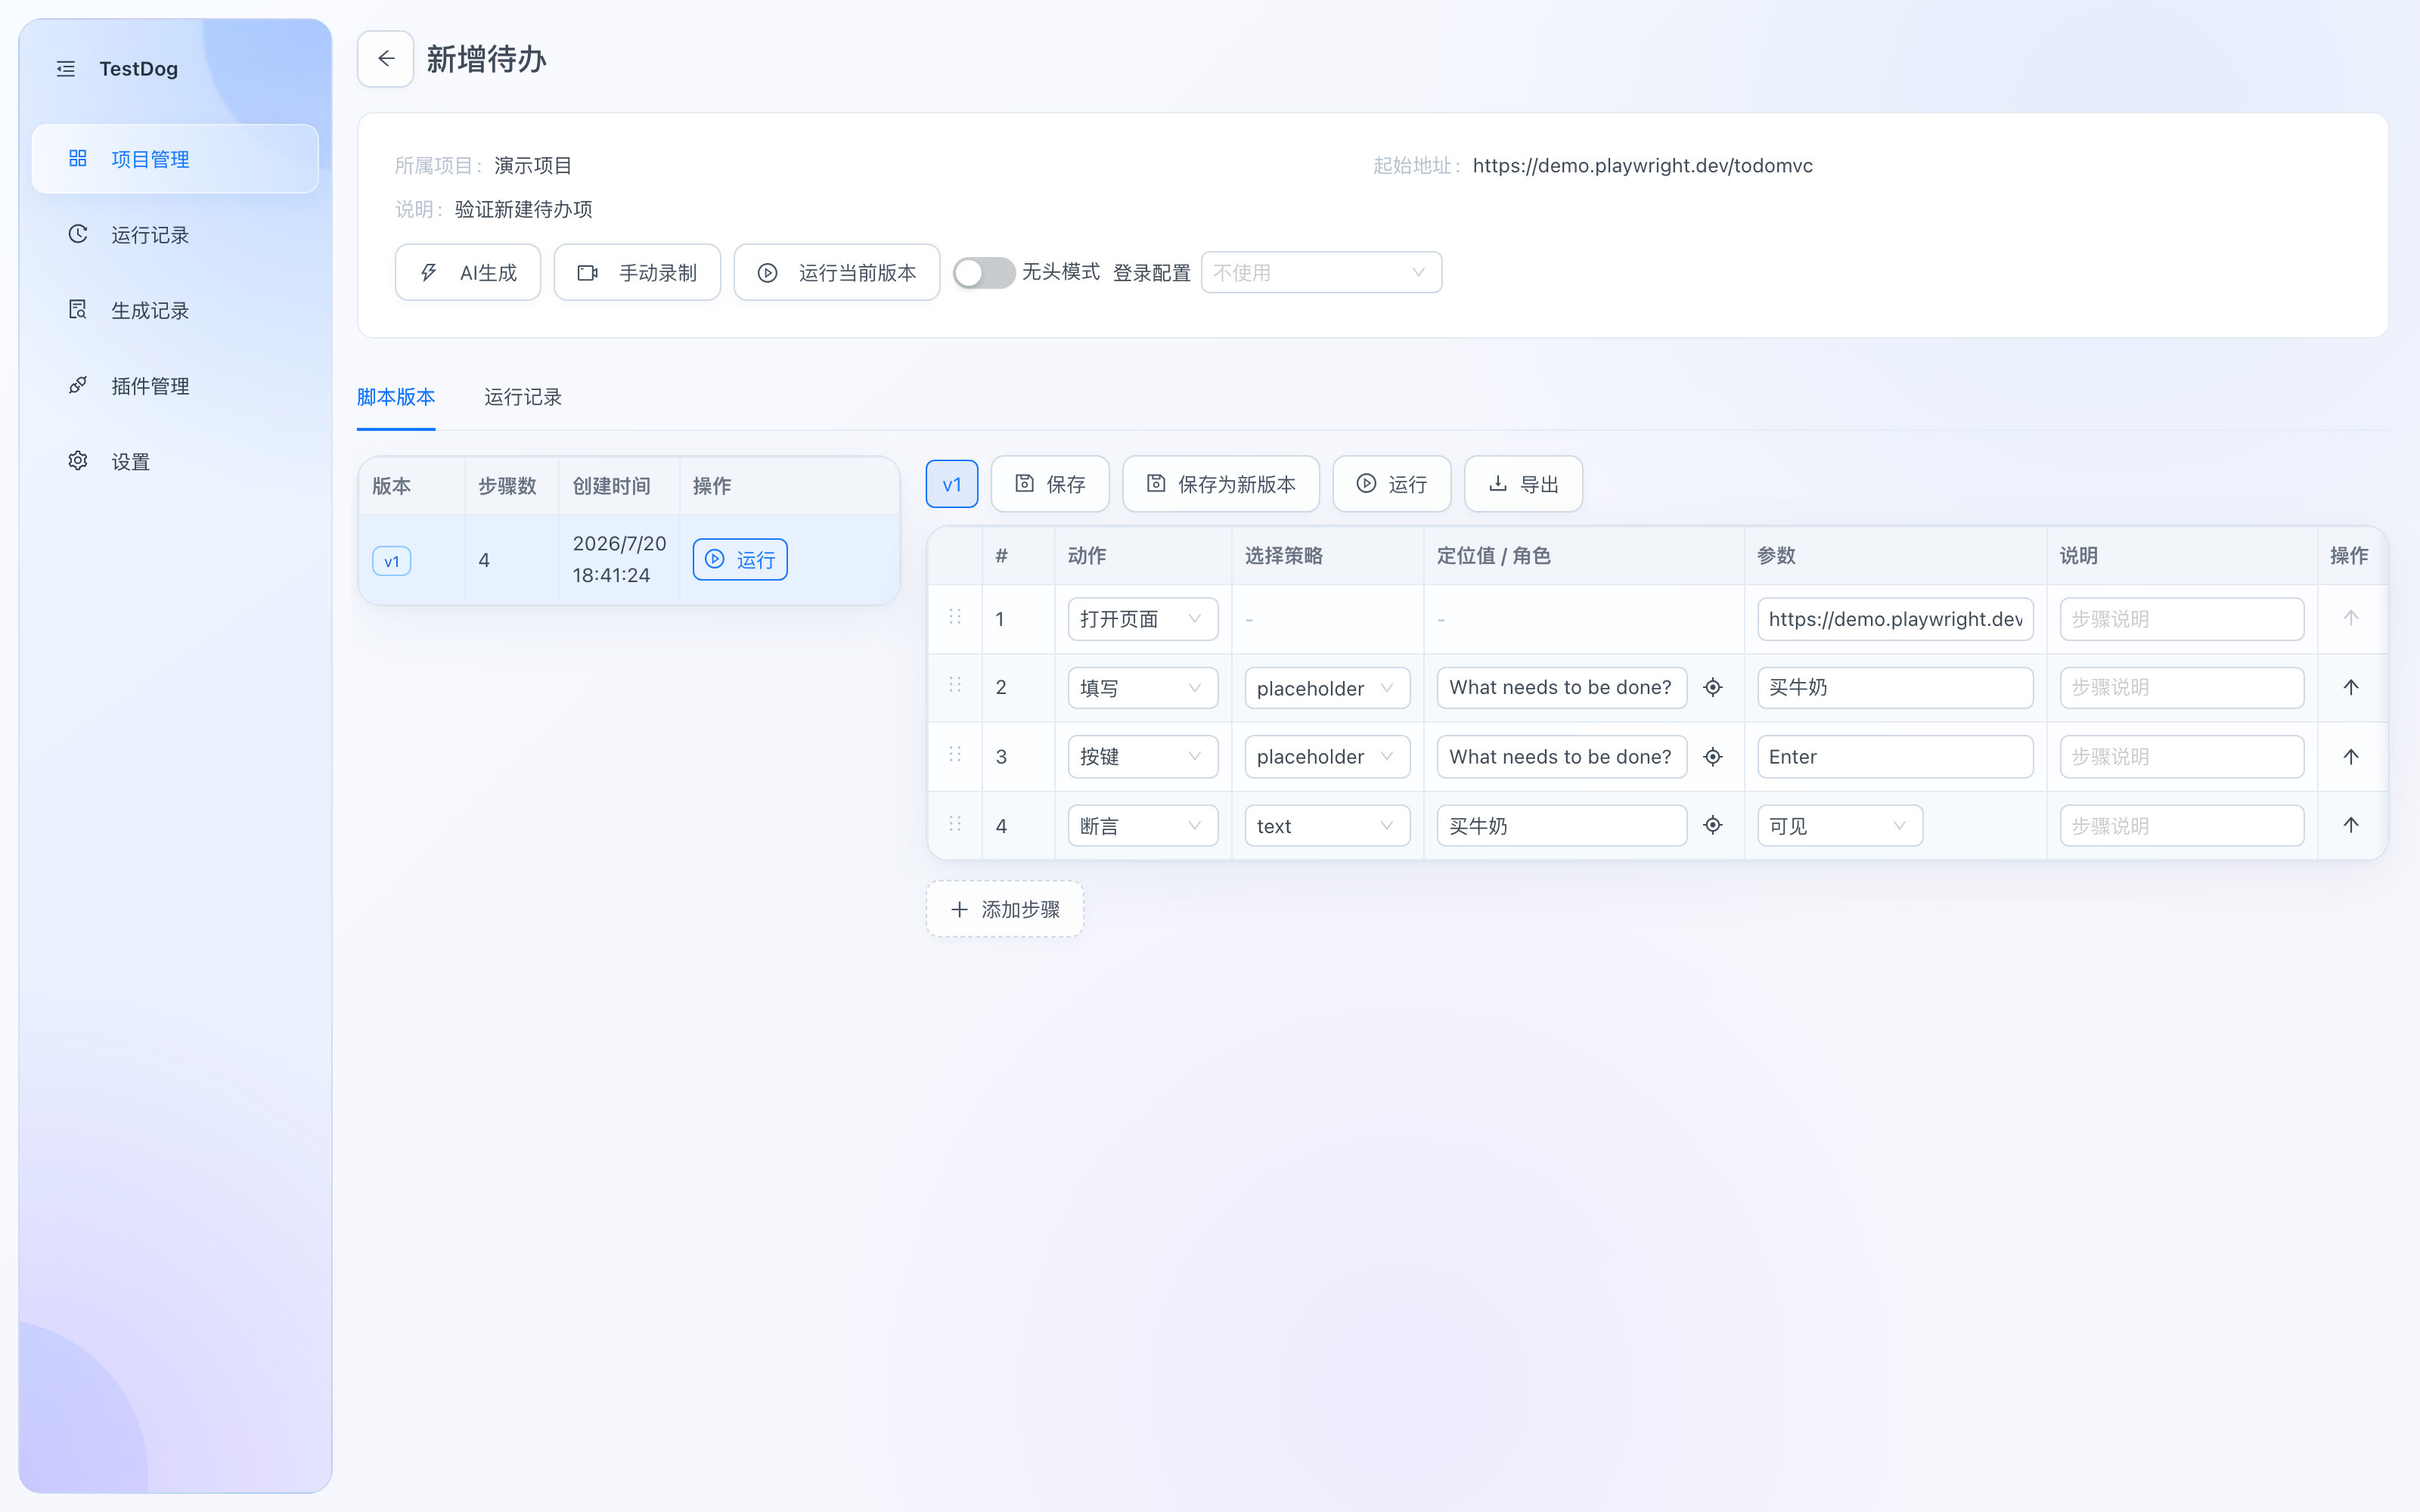
Run detail: per-step status, duration and failure info
- Per-step results: action, status (passed/failed), self-healed flag, duration, token usage and message of each step.
- Run log: browser viewport, login-config state, and each
goto / fill / press / assert → PASSED/FAILED. - Failure diagnostics: failed steps save a screenshot automatically and collect browser console and network logs — usually enough to tell an app bug from a script fix.
- Export (top right): run results as JSON / Excel (test report).
Assertions & self-healing details
For assertion types (UI / API / WebSocket), the self-healing mechanism and write-back, see Replay.